US Dollar Forecast: How Will US Inflation Data Impact Yields and USD?
US DOLLAR OUTLOOK
- The U.S. dollar index advanced and settled near its highest level since early March on Friday, rising for the eighth consecutive week
- The greenback's recent upward momentum has been driven by rising bond yields in an environment of resilient economic activity and sticky inflation
- The August U.S. CPI report will steal the spotlight in the coming week and will likely set the tone for the FX markets in the near term.
Pipscollector.com - The U.S. dollar, as measured by the DXY index, closed the week above the psychological 105.00 handle, settling around its highest level since early March. This marked its eighth consecutive week of gains and the longest winning streak since 2014 – a bullish run catalyzed by the resurgence in U.S. Treasury yields on the back of a hawkish repricing of the Federal Reverse’s policy path.
The chart below shows how the DXY index has closely tracked the uptrend in U.S. bond yields since mid-July.
US DOLLAR INDEX VERSUS US TREASURY YIELDS

Source: TradingView
The FOMC has raised borrowing costs 11 times since 2022 as part of a strategy to quash rampant inflation, bringing its benchmark rate to a range of 5.25% to 5.50%, the highest in 22 years. Despite the forceful actions by the Fed, the current tightening cycle is likely not yet over, considering the prevailing macroeconomic conditions.
Recent data has shown that the economy, rather than weakening, has reaccelerated this summer, contrary to historical experience in times of aggressive central bank monetary policy. For instance, the ISM services sector PMI jumped in August to 54.5 from 52.7 previously, topping all projections and reaching its strongest reading since February. Given these positive developments, the Atlanta Fed's GDP Nowcast indicates that output is poised to grow at an annualized rate of 5.6% in the third quarter.
The resilience of the economy, coupled with tight labor markets, will keep household spending healthy for now, putting upward pressure on aggregate demand – a key driver of inflation. This could compel policymakers to deliver additional tightening this year despite their pledge to “proceed carefully” going forward.
Turning our attention to the forthcoming FOMC meetings, investors anticipate no change in the policy stance in September, but see the November conclave as “live”, with a 43.6% probability assigned to a quarter-point hike. This likelihood may increase in the days ahead, particularly if the upcoming U.S. inflation report reflects heightened inflationary pressures.
FOMC MEETING PROBABILITIES
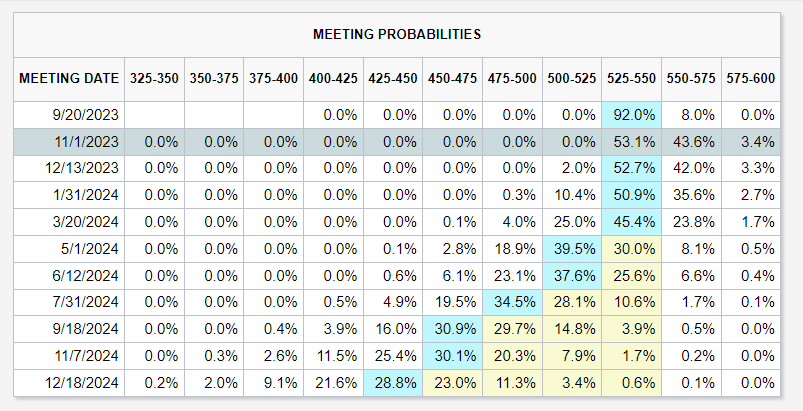
Source: CME Group
The U.S. Bureau of Labor Statistics will release August consumer price numbers on Wednesday. Projections suggest headline CPI rose 0.6% m/m last month, pushing the annual rate to 3.6% from 3.2% in July. The core gauge, for its part, is seen climbing 0.2% m/m, with the 12-month reading easing to 4.3% from 4.7% prior.
An upward deviation of the actual data from market estimates would be positive for the U.S. dollar insofar as it would strengthen the case for further policy firming. Conversely, if the results align with or fall short of expectations, the greenback could suffer a setback, erasing some of its recent gains and losing ground against its top peers.
US ECONOMIC CALENDAR

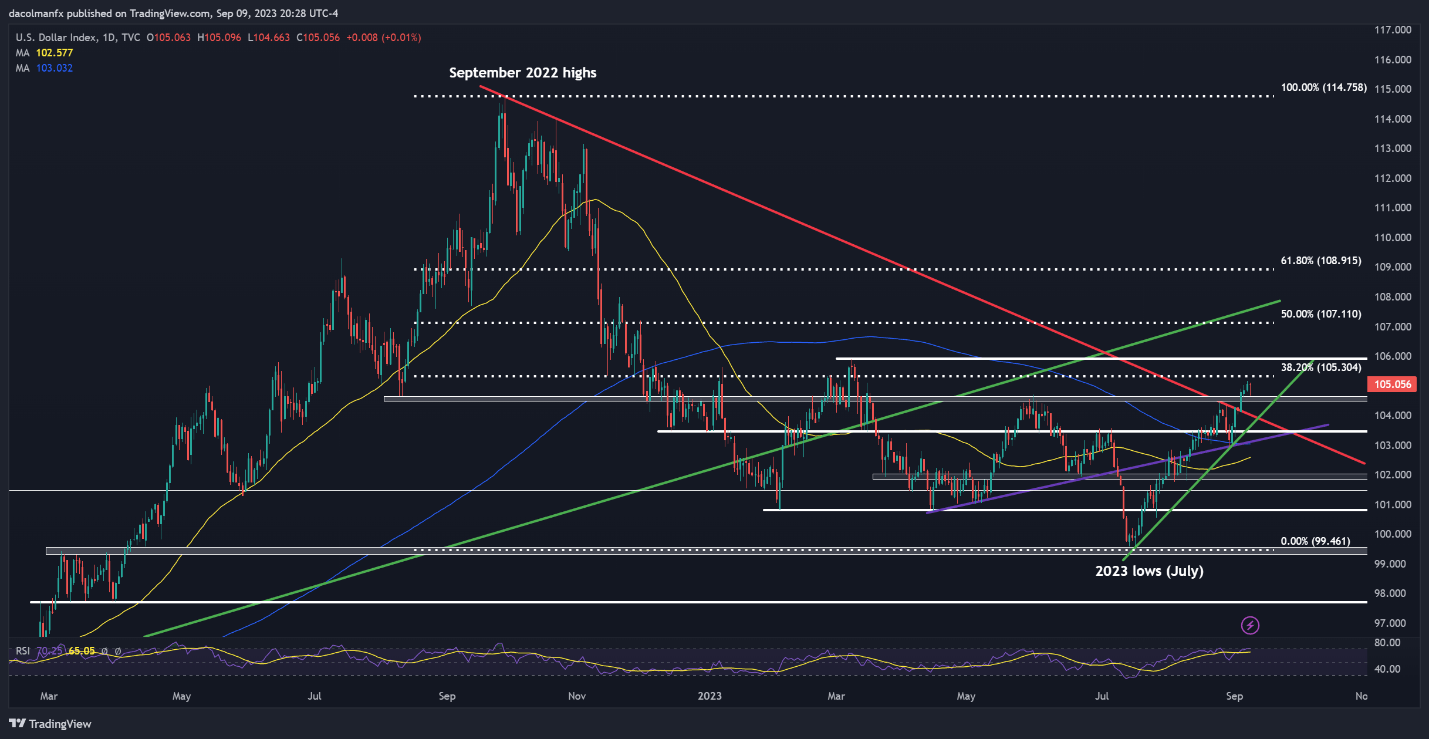
US DOLLAR INDEX (DXY) TECHNICAL ANALYSIS
The U.S. dollar broke out on the topside this past week, clearing trendline resistance and its May peak decisively before setting a fresh multi-month high above the 105.00 handle ahead of the weekend.
With the bulls in clear control of the market, the DXY index might maintain its upward momentum in the coming days, particularly if it manages to remain above technical support at 104.50. In such a scenario, prices may charge towards 105.30, a key ceiling created by the 38.2% Fib retracement of the September 2022/July 2023 slump. On further strength, a retest of the 2023 highs becomes increasingly probable.
On the flip side, if sellers regain the upper hand and trigger a pullback, initial support appears at 104.50, followed by 103.95. Below these thresholds, the next area of significance in the event of extended weakness is situated at 103.50.
US DOLLAR (DXY) TECHNICAL CHART
Read more Market Analysis from Pipscollector to update the latest information to help your trading process.
- Pipscollector -