Oil Price Forecast: OPEC+ Supply Expectation Sustains Key Crude Oil Benchmarks
CRUDE OIL ANALYSIS & TALKING POINTS
- Where to next for OPEC+?
- USD looks to NFP for guidance on Fed monetary policy.
- Overbought zone on both WTI and Brent could indicate downside to come?
CRUDE OIL FUNDAMENTAL BACKDROP
Pipscollector.com - WTI crude oil and Brent crude oil remain elevated at critical levels last seen in mid-April driven by anticipated production cuts from OPEC+ which is scheduled to take place at the OPEC+ Joint Ministerial Monitoring committee meeting on Friday this week. If an extension is announced, crude oil prices are likely to maintain around these improved levels while reduced supply in other regions including Nigeria and Canada have supported could augment any upside.
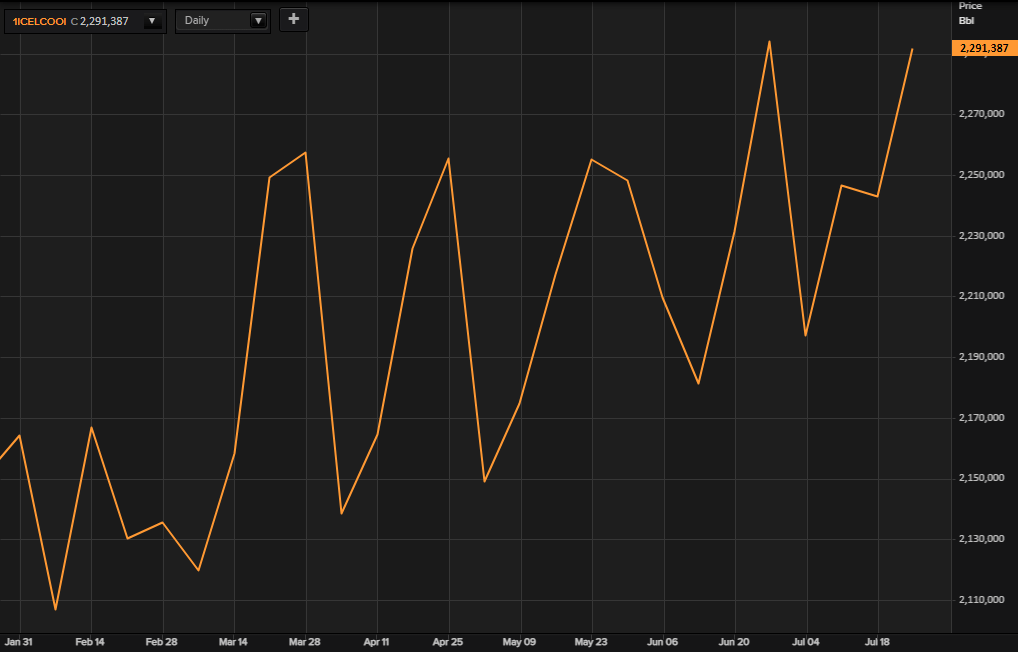
The recent CFTC report below shows long positioning on Brent crude oil increasing and corroborating recent price action.
ICE BRENT CRUDE OIL CFTC POSITIONING – TOTAL OVERNIGHT INTEREST
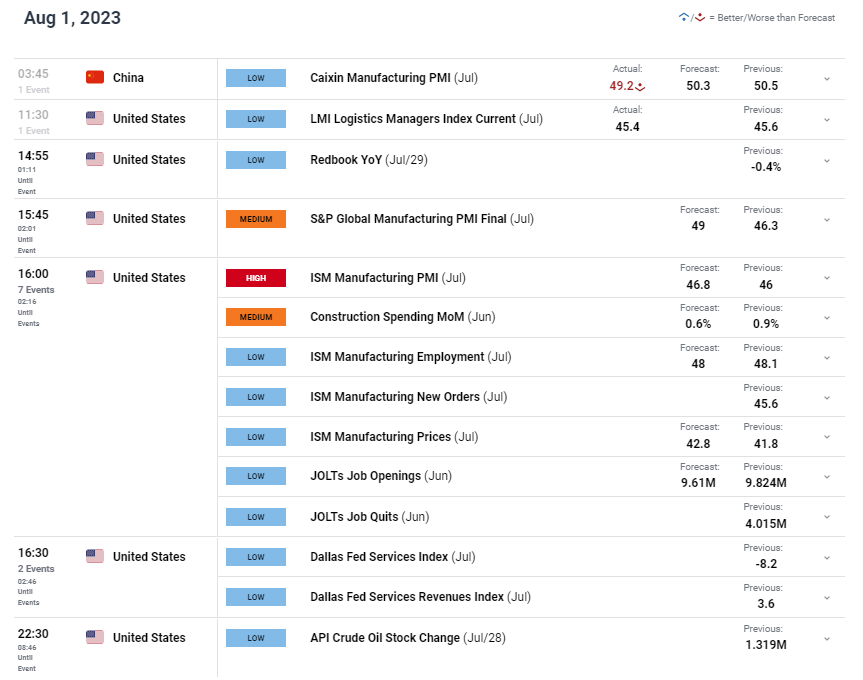
Today’s miss on Chinese manufacturing PMI (Caixin) which has now slipped into contractionary territory has weighed on crude oil prices and has raised concerns around the Chinese economy. Later today (see economic calendar below), US ISM manufacturing PMI’s and JOLTS data will come into focus with the latter giving analysts some insight into the jobs market ahead of Friday’s Non-Farm Payroll (NFP) release.
The ‘soft landing’ rhetoric has been gaining traction of recent post-core PCE last week and serves as a supportive factor for crude oil prices as recessionary fears have been minimized. Weaker labor numbers may have a moderating influence on the USD thus opening up further upside for crude oil and vice versa. The weekly API crude stock change figure will round off the US trading session for crude oil with oil bulls awaiting another drop.
ECONOMIC CALENDAR (GMT +02:00)
TECHNICAL ANALYSIS
ICE BRENT CRUDE OIL DAILY CHART
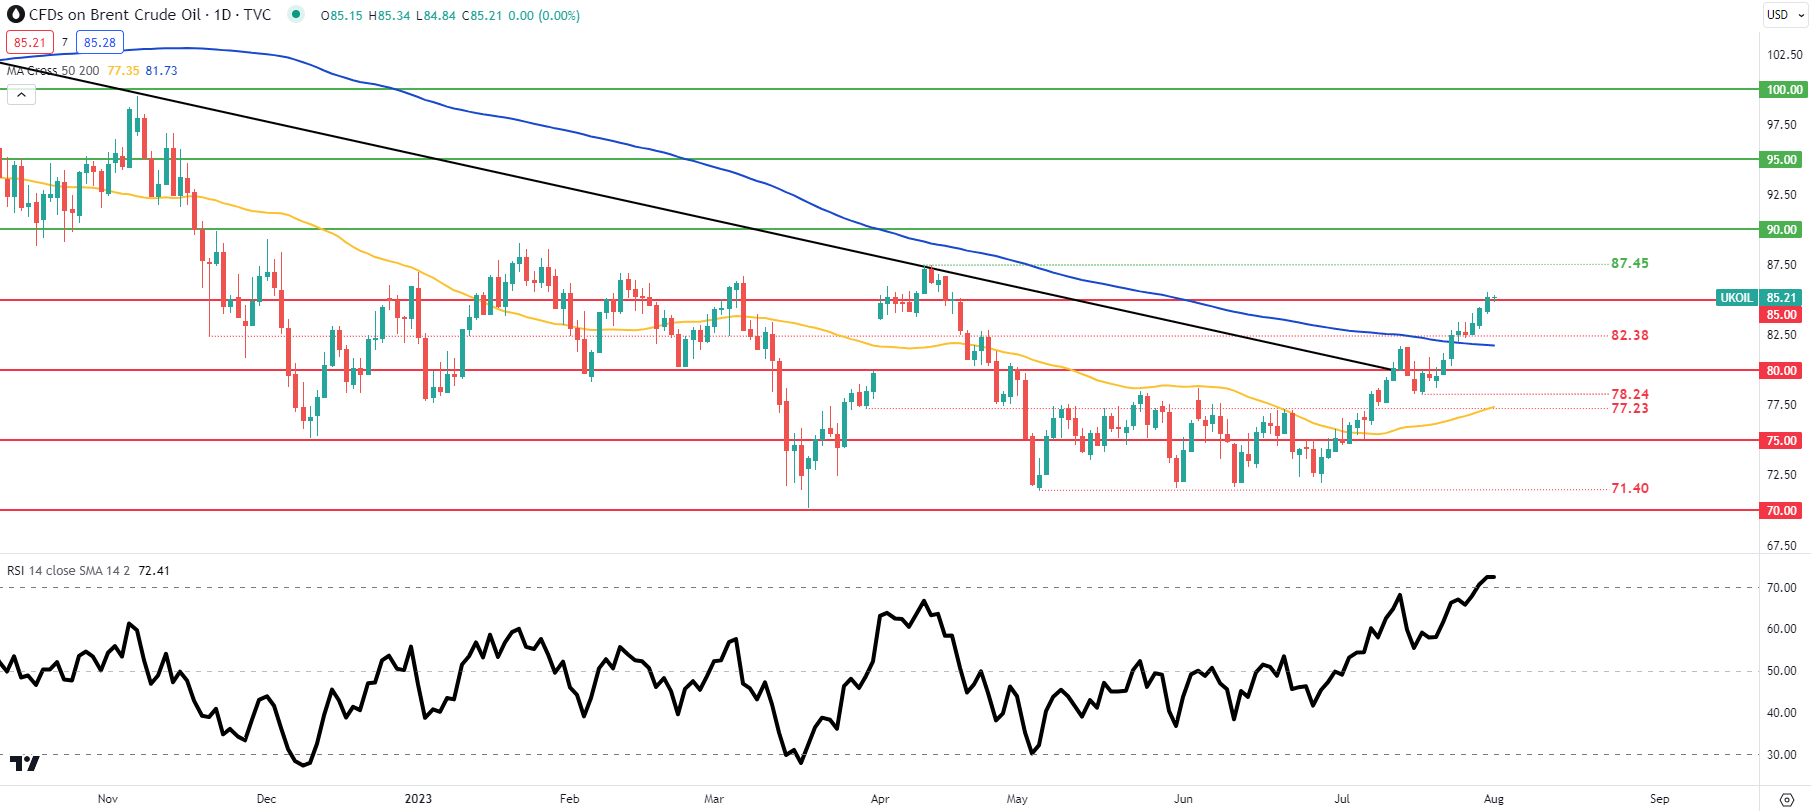
Key resistance levels:
- $90.00
- $87.45
Key support levels:
- $85.00
- $82.38
WTI CRUDE OIL DAILY CHART
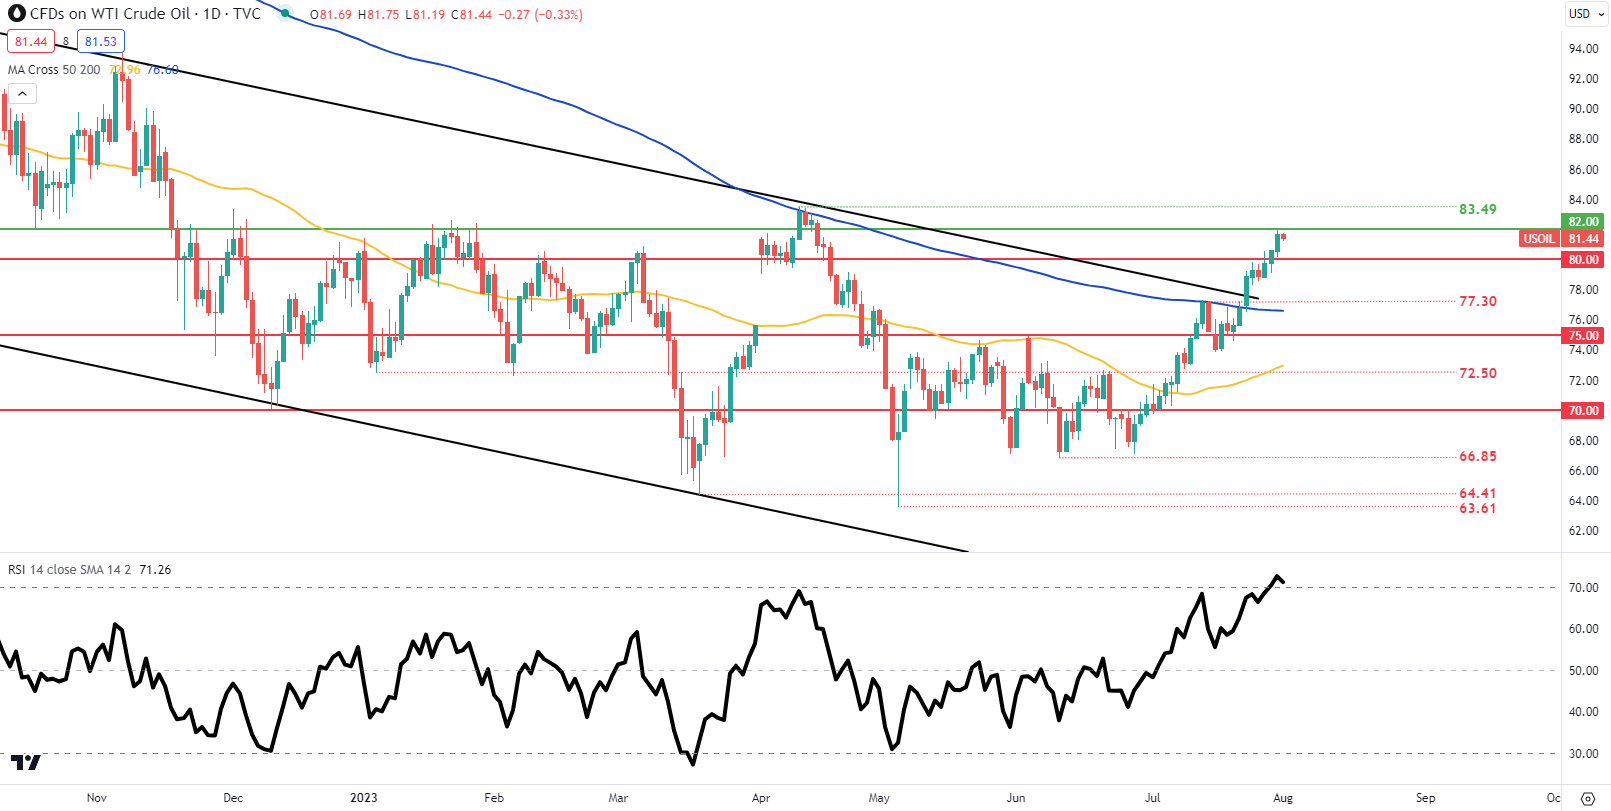
Key resistance levels:
- $83.49
- $82.00
Key support levels:
- $77.30
- 200-day MA
Price action on the daily ICE Brent and WTI crude oil charts above have both trading within the overbought region as measured by the Relative Strength Index (RSI), and above the 200-day moving average (blue). While there is still room for additional upside, I forecast some consolidation that could be prompted by fundamental dynamics mentioned above in the week to come. Considering the current key area of confluence, traders may be cautious as to their trading bias and remain cautious heading into another big data week.
IG CLIENT SENTIMENT: BULLISH
IGCS shows retail traders are NET SHORT on Crude Oil, with 56% of traders currently holding short positions (as of this writing). At DailyFX we typically take a contrarian view to crowd sentiment resulting in a short-term upside disposition.
- Pipscollector -