Nasdaq 100 and CAC40 Struggle to Move Higher, Hang Seng Falls Again After Weak China Data
Pipscollector.com - Summary of outstanding movements of stock indices around the world
NASDAQ 100, CAC40, HANG SENG ANALYSIS AND CHARTS
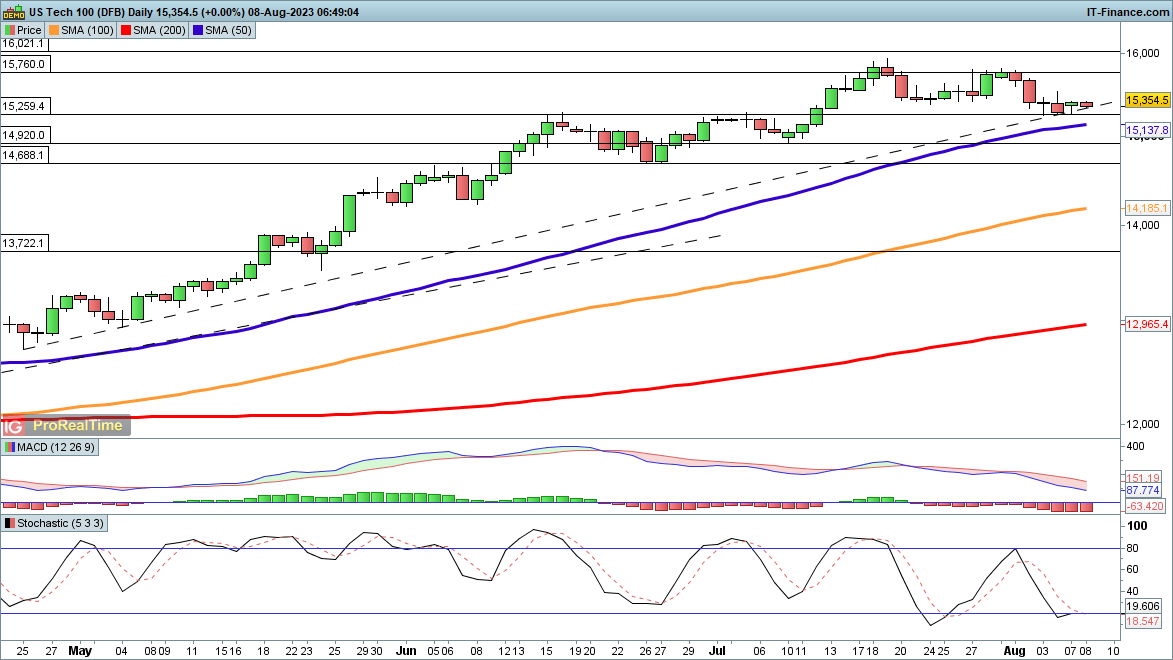
Nasdaq 100 holds support for now
The price rallied off the 15,260 level yesterday, stemming any further declines for now.Crucially it also held trendline support from late April and remains above it in early trading today. A rally back above 15,400 could trigger a bullish stochastic crossover, and then see the price move on to target 15,760 and then the mid-July highs at 15,930.
Sellers will want to see a close below 15,260 to result in a potentially firmer move back below the trendline and horizontal support. This might suggest a more sustained pullback in the short term.
NASDAQ 100 DAILY PRICE CHART
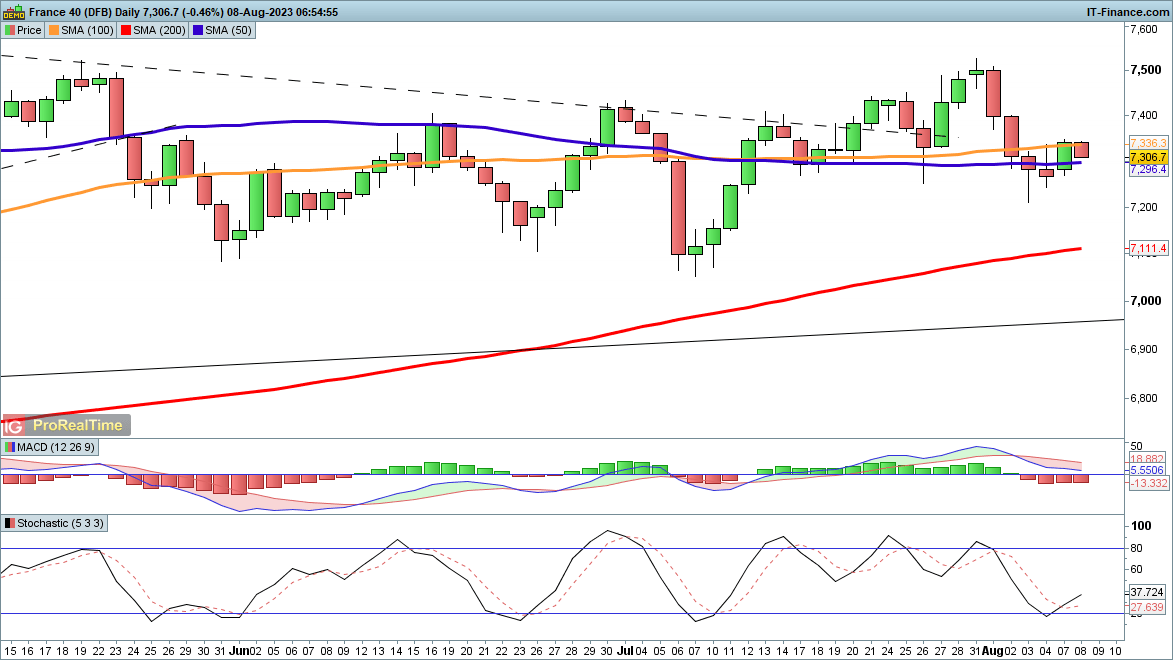
CAC40 rebound struggles
The index’s choppy performance continues, though having recovered from last week's low a more bullish view might yet emerge.Monday’s session saw a close back above the 50-day SMA, and this might then help to put the buyers in charge once more. Early trading has not seen much bullish follow-on, with the price dropping back from the 100-day SMA. A close above 7350 could see the price move on to the July highs.
A reversal and close back below 7250 might suggest that the sellers are in charge once again.
CAC40 DAILY PRICE CHART
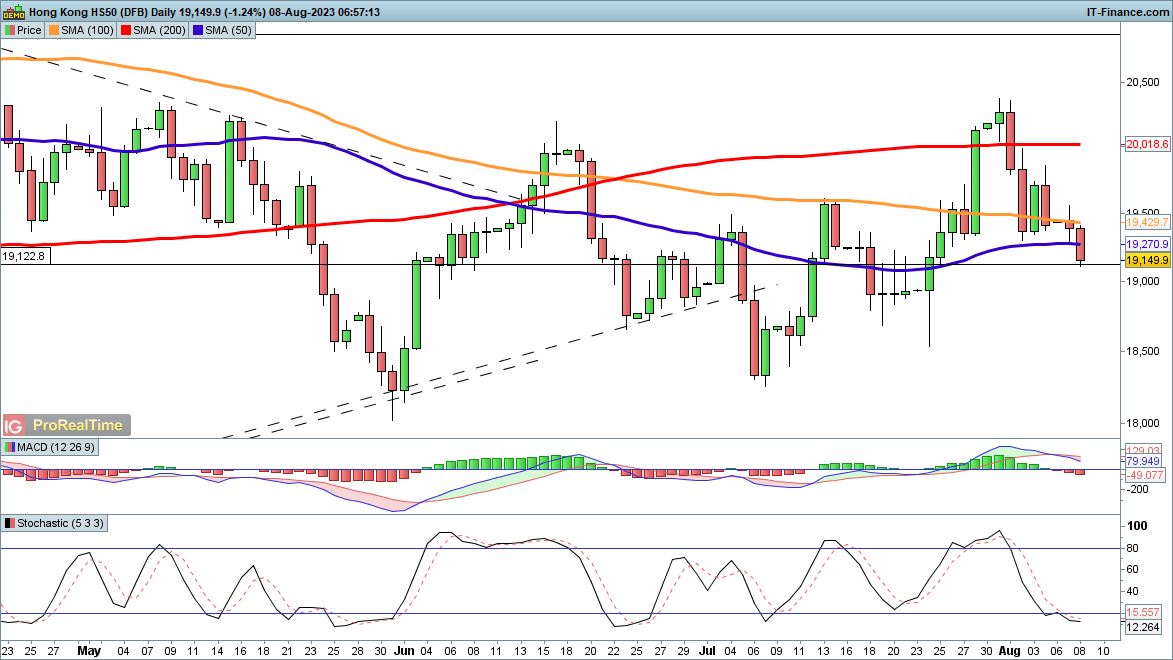
HANG SENG AT TWO-WEEK LOW
The rebound of late July has now fizzled out, and a more bearish view prevails once again. Since the end of July the index has fallen back below the 200-, 100- and now 50-day SMAs. This leaves the sellers in charge, especially given the bearish MACD crossover of the past session.
Further declines now target the 18,500 low from late July, and then to the actual July low of around 18,300. A close back above 19,500 would be needed to suggest that the buyers may have been able to reassert control.
HANG SENG DAILY PRICE CHART
- Pipscollector -