Japanese Yen Weekly Outlook: USD/JPY Triangle Breakout, Key US Data in Focus
Pipscollector - Weekly Japanese Yen (JPY) Forecast and Analysis Report
JAPANESE YEN WEEKLY FORECAST: BEARISH
- The Japanese Yen extended its losing streak against its major peers
- External focus meant rising Treasury yields weakened the currency
- Ahead, eyes are on US debt ceiling talks and key Fed inflation gauge
- USD/JPY eyeing Ascending Triangle breakout confirmation?
Fundamental Analysis
The Japanese Yen fell against its major counterparts this past week, extending a string of recent losses. Over the past 2 weeks, JPY has weakened about 2.3 percent against the US Dollar. This has been the worst 10-day period for the currency since the middle of February. Could the following week bring more harm to the Japanese Yen?
JPY’s decline has been stemming from factors outside of Japan. A still-static Bank of Japan is leaving the currency sensitive to what is going on around it. It should come as little surprise that USD/JPY’s rise of late has coincided with a recovery in Treasury yields. The latter reflects financial markets slowly pricing out near-term Federal Reserve rate cut expectations.
In recent weeks, underlying US inflation data remained sticky, jobless claims surprised lower (signaling a still-tight labor market), and retail sales were upbeat. Overall, while recession fears have not fully been retracted, financial markets have been treating incoming data and news as a sign of resilience. That said, there are a few risks ahead.
US debt ceiling woes were put back in the spotlight as last week wrapped up after policymakers appeared to hit another snag. As such, this remains a key focus for markets in the near term. Meanwhile, all eyes will turn to the Core PCE Deflator in the week ahead, which is the Fed’s preferred inflation gauge. Further signs of sticky price pressure may continue cooling rate-cut bets, extending USD/JPY’s winning streak.
Technical Analysis
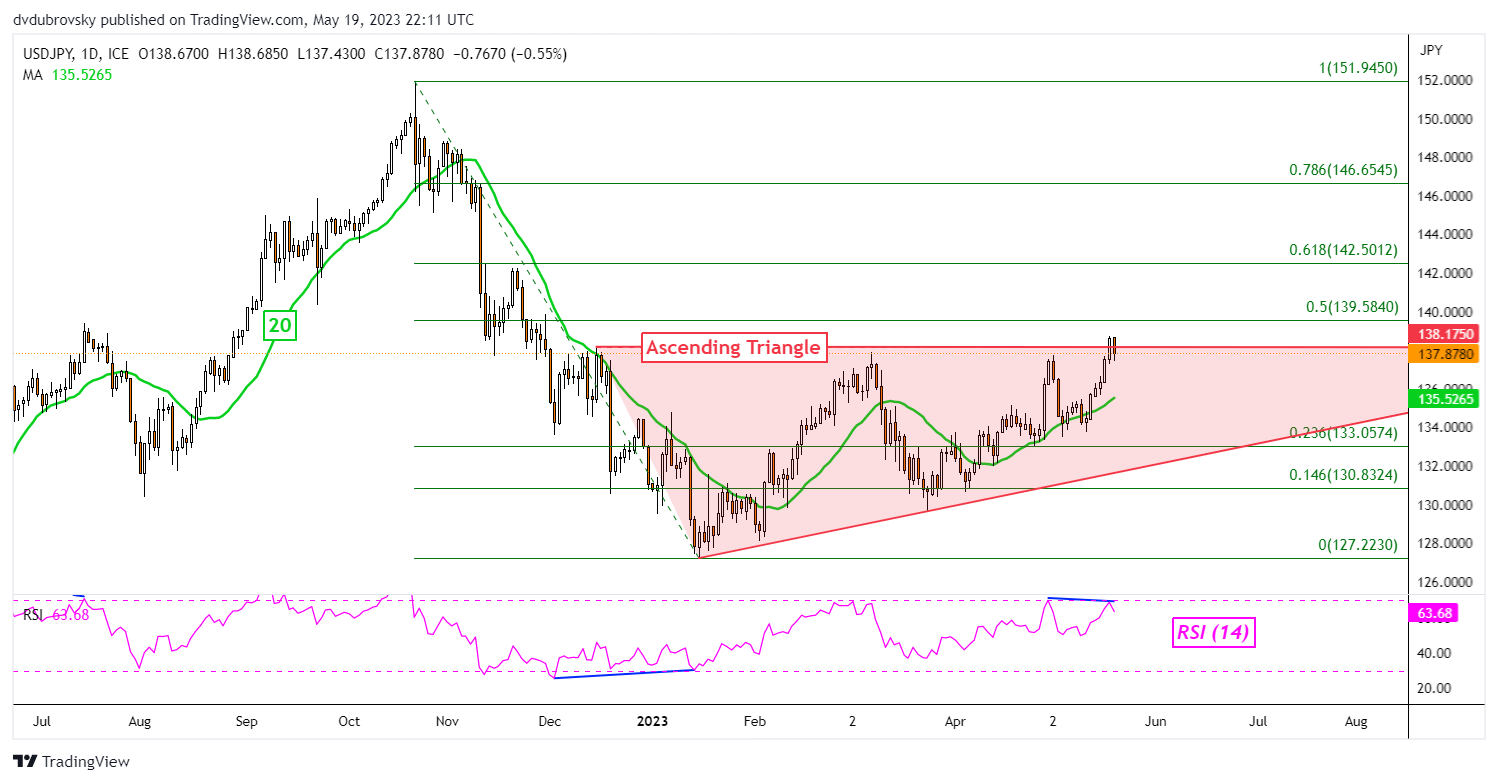
On the daily chart, USD/JPY almost broke above an Ascending Triangle chart formation. But, on Friday, prices turned back into the formation after failing to hold a breakout through resistance. Negative RSI divergence is showing fading upside momentum. Further losses may place the focus on the 20-day Simple Moving Average (SMA). Otherwise, pushing back higher may open the door to extending gains. That places the focus on the 61.8% Fibonacci retracement level at 142.50.
USD/JPY Daily Chart
- Pipscollector -