Gold (XAU/USD) and Silver (XAG/USD) Latest Price Outlooks
Gold Price (XAU/USD), Silver Price (XAG/USD) Analysis and Charts
- Bond yields fall on soft economic data.
- Silver has outperformed gold by a decent margin over the last week.
The global economy is in trouble
Pipscollector.com - Global economies are struggling, according to the latest round of PMI releases, with a raft of G7 countries seeing their manufacturing and services sectors contracting sharply. The Euro Zone composite index fell to 47.0, a 33-month low, the UK composite index slumped to 47.9, a 31-month nadir, while the comparable US index slipped to 50.4, the lowest level in six months. A reading below 50 suggests economic contraction. Financial markets downgraded future interest rate hikes across the market after these releases, sending government bond yields spinning lower.
US bond yields
US 10-year yields are around 16 basis points lower at 4.20%, the benchmark 10-year gilt yield has fallen from 4.73% on Tuesday to a current level of 4.43%, while the de-facto Euro Zone 10-year benchmark, the German Bund, fell by 20 basis points to 2.50%.
Lower government bond yields, and fears of economic stagnation, have boosted gold and silver in the last couple of days as traders reassess any further monetary tightening. Economic data will continue to drive central bank action and upcoming growth, inflation, and labor market releases will need to be closely followed. On Friday, Fed chair Jerome Powell, ECB President Christine Lagarde, and Bank of England governor Andrew Bailey all speak at the Jackson Hole Symposium, an ideal platform for them to outline their latest views on their respective economies.
Impact on Silver asnd Gold prices
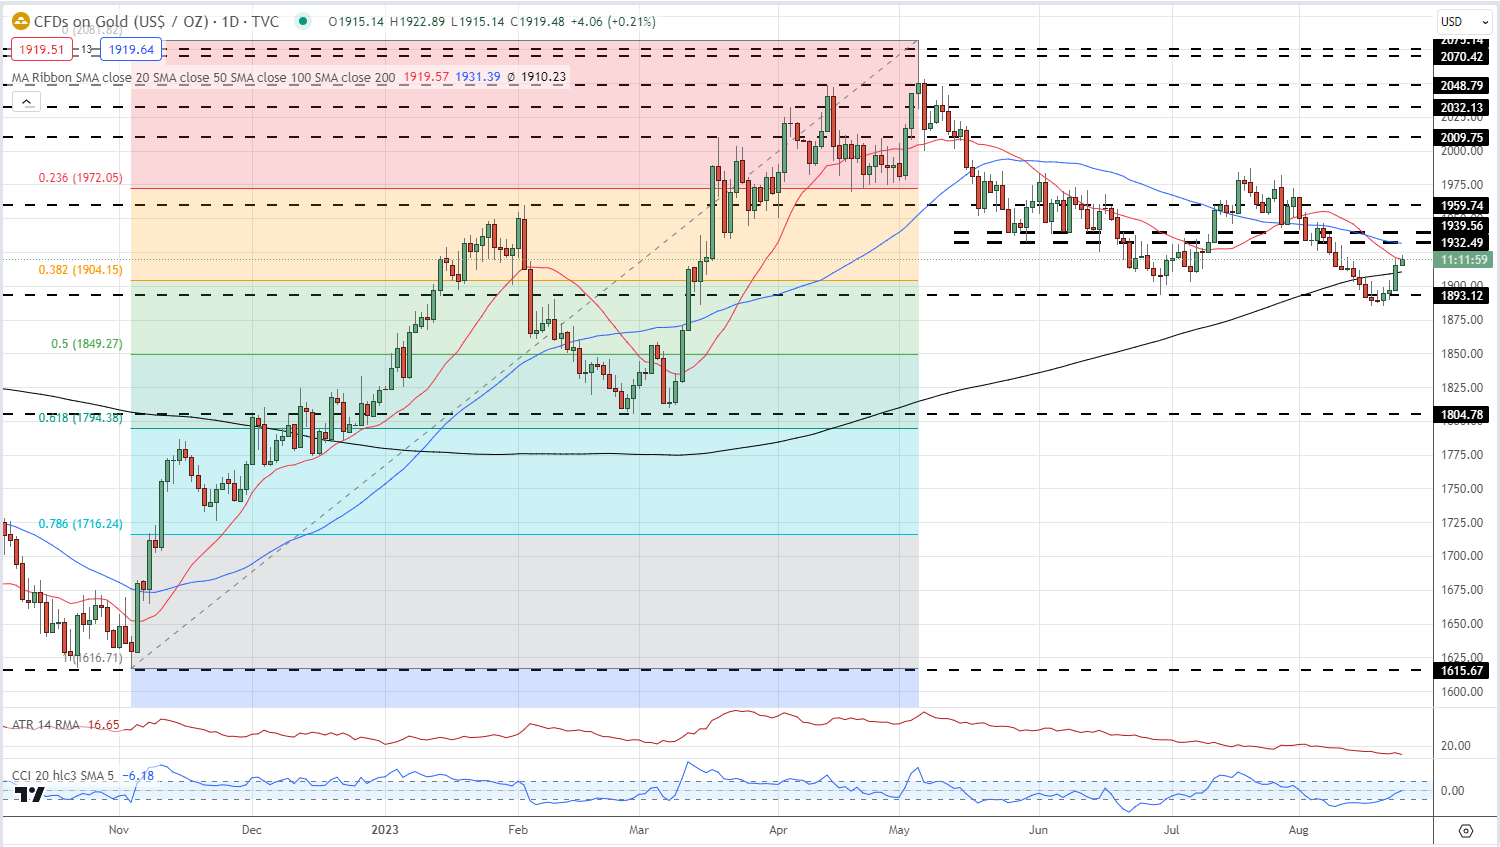
With bond yields falling, gold quickly moved back above $1,900/oz. and currently trades on either side of $1,920/oz. Above a prior zone of support that is now initial resistance between $1,930/oz. and $1,940/oz. Gold opened back above the 200-day simple moving average and is now testing the 20-day sma. A recent double-low at $1,885/oz. provides first-line support.
GOLD DAILY PRICE CHART – AUGUST 24, 2023
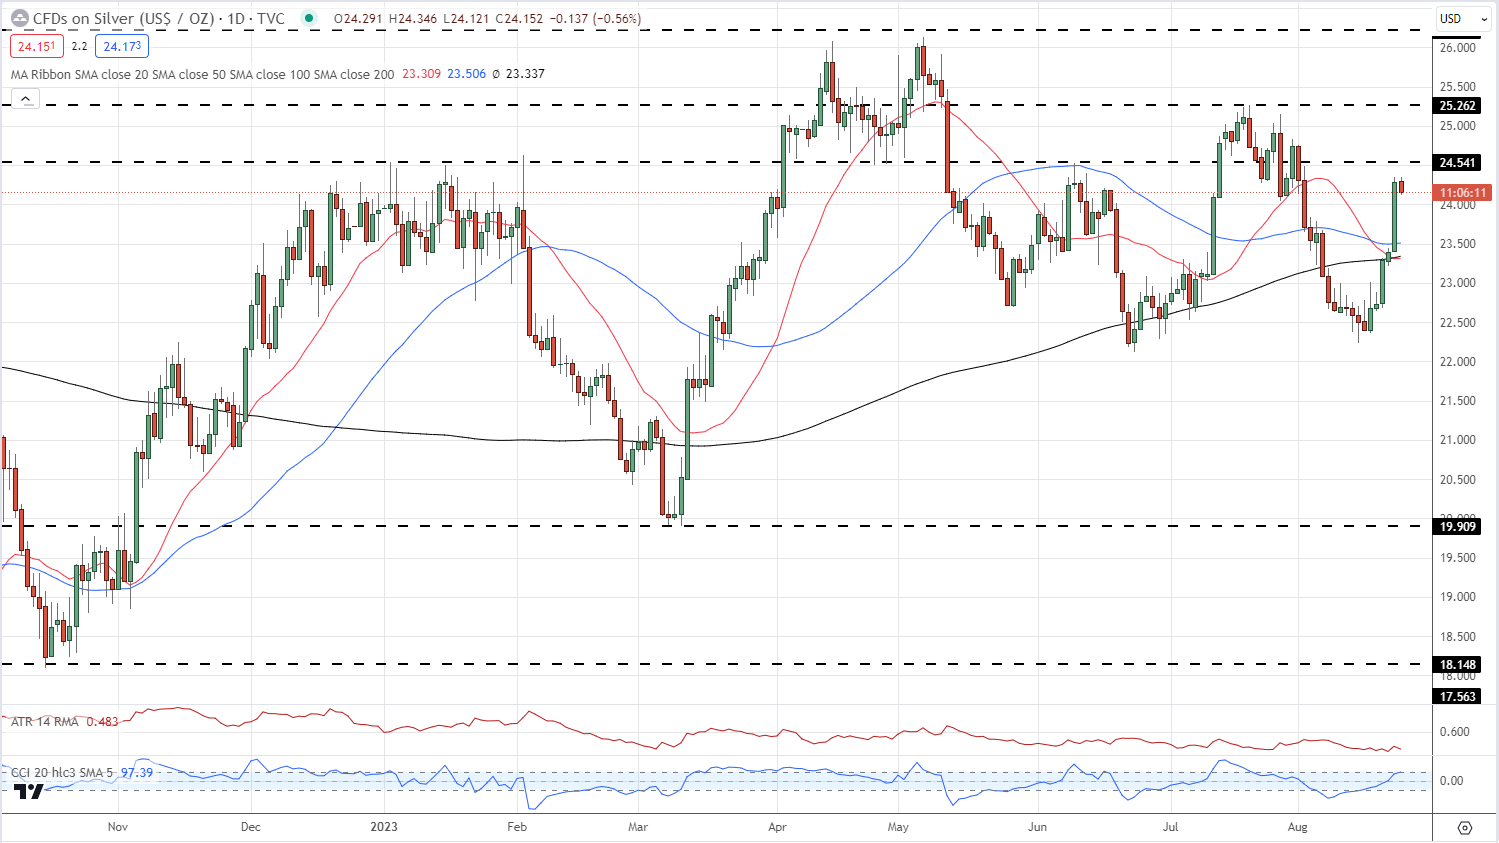
The silver chart looks positive with yesterday’s rally taking the precious metal back above all three moving averages. Initial resistance is seen at $24.51 ahead of a multi-week swing high at $25.26. The cluster of moving averages around the $23.30 to $23.50 area should provide first-line support.
SILVER DAILY PRICE CHART – AUGUST 24, 2023
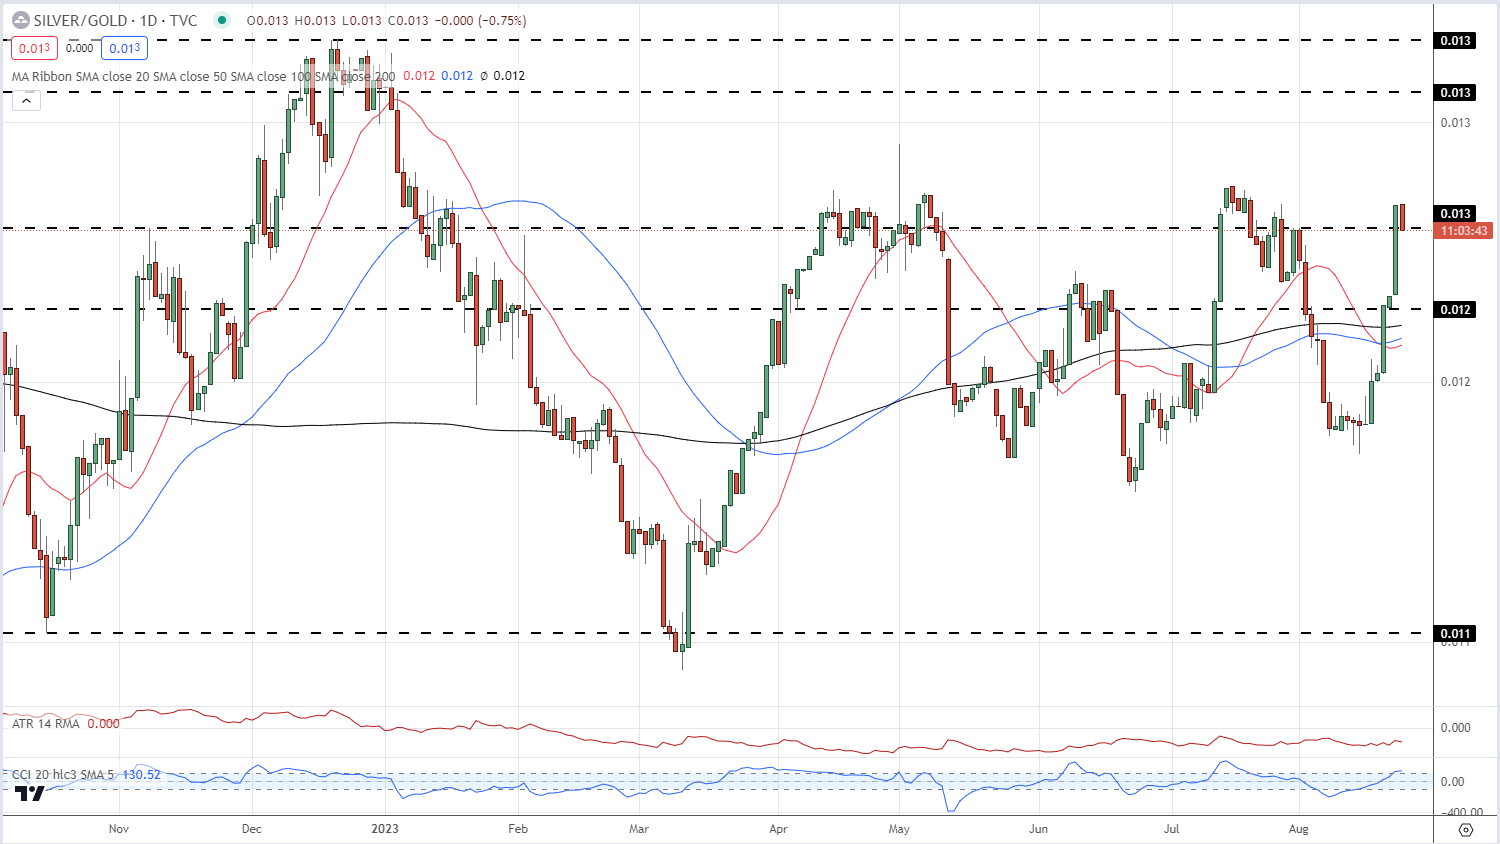
Silver has outperformed gold over the last 10 days and broke above a prior level of resistance. This level is currently being tested to see if it will act as further support, allowing silver’s outperformance against gold to continue.
SILVER/GOLD SPREAD DAILY PRICE CHART – AUGUST 24, 2023
Read more Market Analysis from Pipscollector to stay updated with useful information for your trading process
- Pipscollector -