Gold and Silver Price Forecast: XAU/USD & XAG/USD at Mercy of US Inflation Data
GOLD AND SILVER OUTLOOK:
- Gold and silver prices closed lower this past week, undermined by the recent rally in real yields and the U.S. dollar
- Next week, the July U.S. inflation report will steal the limelight as it can cause significant volatility
- This article discusses key technical levels for XAU/USD and XAG/USD that are worth keeping an eye on in the coming sessions
Gold and Silver prices over time
Pipscollector.com - Gold (XAU/USD) and silver (XAG/USD) ended this past week lower, despite a modest rebound on Friday in the wake of softer-than-expected U.S. labor market data. In the grand scheme of things, prices have remained subdued since late July, when both assets ended a nascent recovery and began to retreat following a furious rally in the U.S. dollar and real rates, two key headwinds for precious metals.
With Treasury yields up across the curve and the U.S. dollar perking up, XAU/USD and XAG/USD will struggle to resume their rebound and advance in a sustained manner, but the situation could change if U.S. incoming data evolves favorably and shows progress in combating elevated price pressures in the country. For this reason, traders are advised to closely monitor the U.S. economic calendar in the near term.
Looking ahead to potential volatility catalysts in the coming week, the latest inflation report, scheduled for release on Thursday, will likely be the most impactful event for markets. This assessment is based on the premise that the new batch of CPI numbers could be key in guiding the Fed’s next steps, thus setting the near-term trading bias for assets sensitive to the outlook for monetary policy.
Unlock the secrets of successful gold trading with our comprehensive "How to Trade Gold Guide." Download it now and take your trading skills to the next level!
UPCOMING US INFLATION REPORT
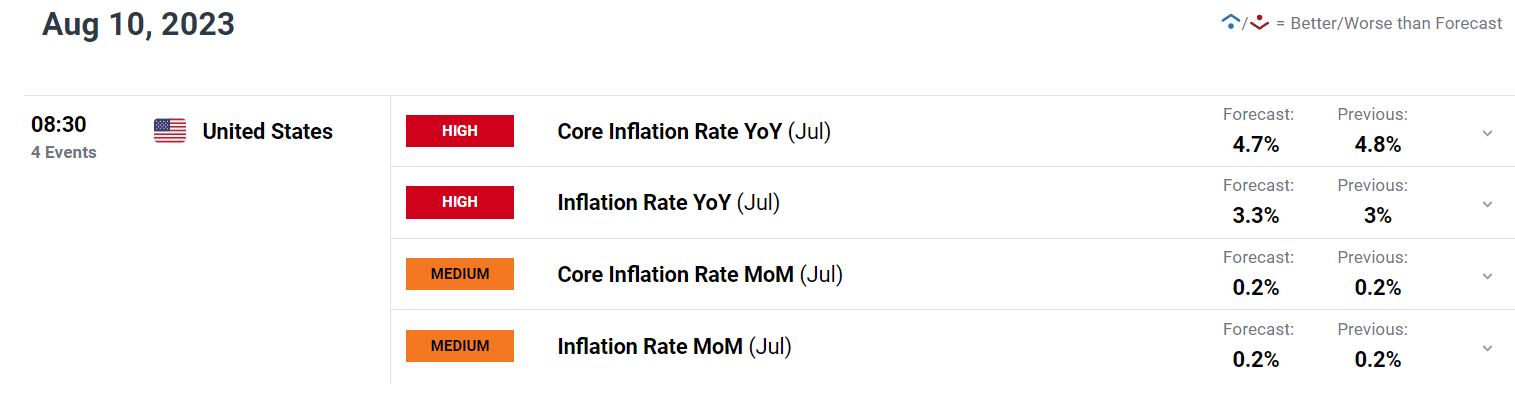
In terms of expectations, headline CPI is forecast to have risen 0.2% on a seasonally adjusted basis in July, pushing the annual rate to 3.3% from the previous 3.0%. The core gauge is also seen advancing 0.2% month-over-month, but the yearly reading is projected to ease slightly to 4.7% from 4.8% in June - a very limited improvement for policymakers.
To gain insight into the broader market trajectory, traders should compare actual CPI figures to consensus estimates, with more weight given to core inflation, which tends to reflect longer-term trends in the economy. That said, any result above 4.7% y-o-y could have a bearish impact on precious metals, as it might boost expectations of another FOMC hike later this year and higher-for-longer rates.
On the other hand, a large downside surprise in the underlying CPI, say 4.5% or below, might trigger a dovish repricing of the Fed’s policy roadmap, exerting downward pressure on bond yields and the U.S. dollar. This scenario could create the right conditions for a more sustained bounce in gold and silver prices in the near term.
GOLD (XAU/USD) TECHNICAL ANALYSIS
Gold managed to stage a modest rebound off a key floor on Friday, but failed to recapture its 50-day simple moving average at $1,945, which now serves as primary resistance to monitor. If prices get rejected from this technical area in the coming days, the bears may regain control of the market, paving the way for a retest of support at $1,930. On further weakness, we could see a move toward the 200-day simple moving average near $1,895.
In contrast, if XAU/USD breaches its 50-day SMA on the topside, bullish momentum could gather pace, the bulls may be motivated to launch an attack on $1,985 and $2,000 thereafter.
GOLD PRICES TECHNICAL CHART
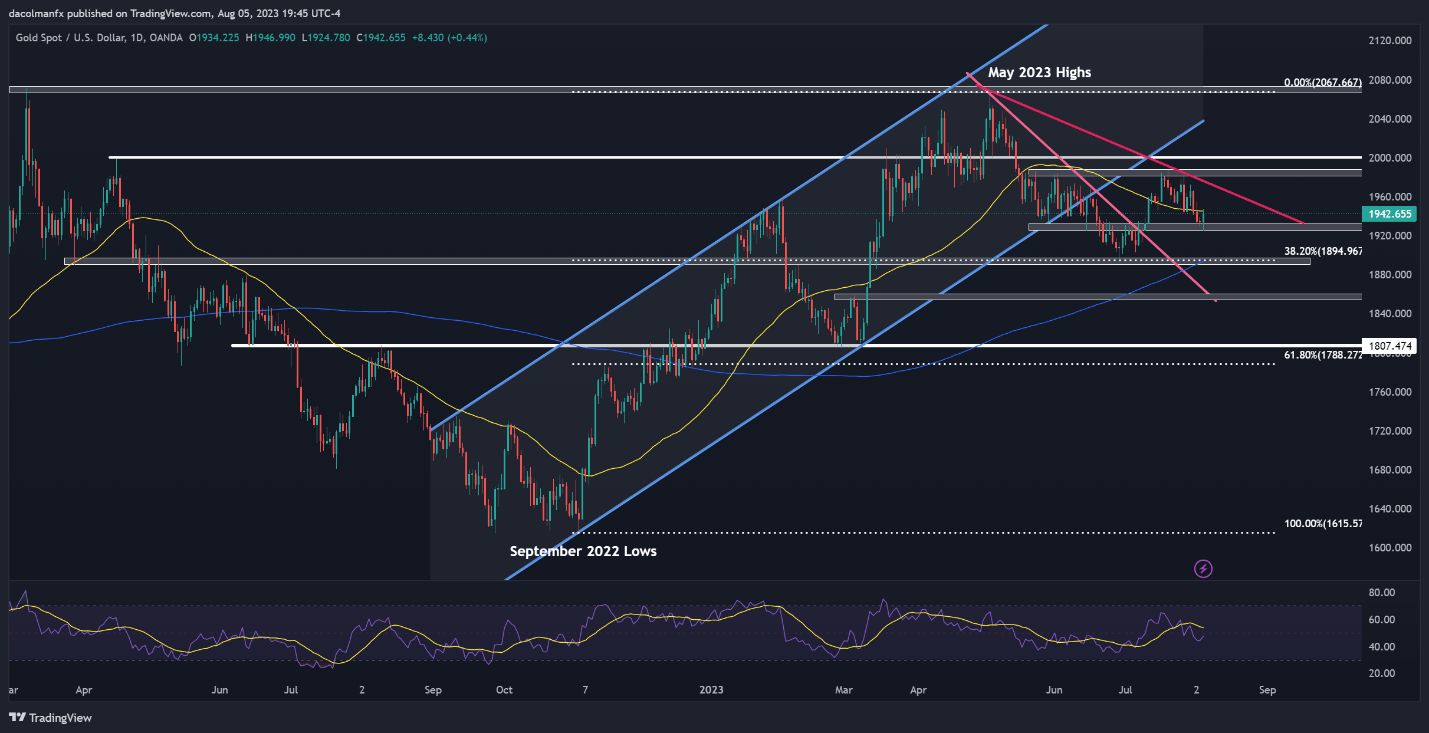
Gold Prices Chart Prepared Using TradingView
XAG/USD) TECHNICAL ANALYSIS
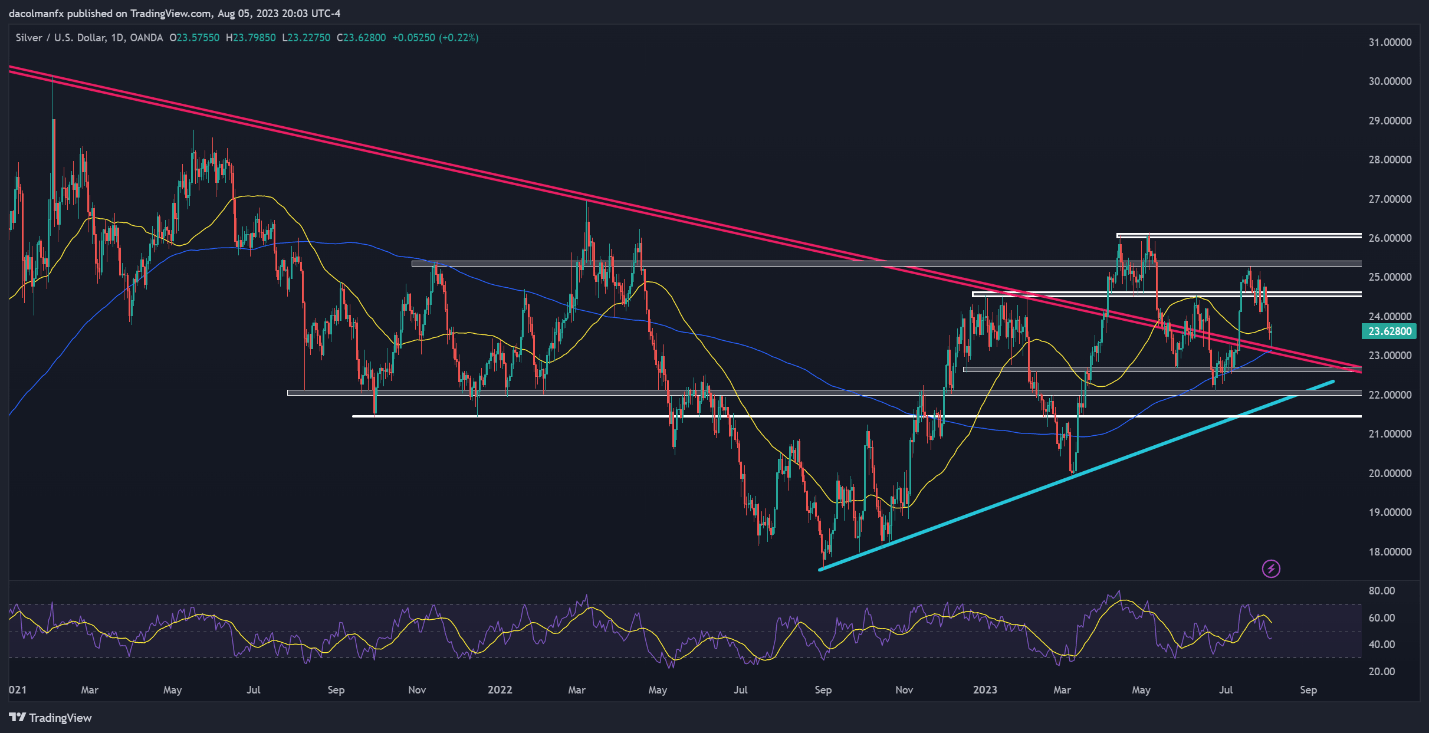
Silver pulled back last week, but encountered support at $23.20, where a key trendline and the 200-day simple moving average converge. The precious metal subsequently bounced from these levels, but has yet to break above its 50-day simple moving average. Should prices overcome this hurdle in the coming trading session, we could see a move towards $24.60, followed by $25.35.
On the flip side, if sellers regain the upper hand and trigger a bearish reversal, the first technical floor to watch rests at $23.20, but further losses may be in store on a push below this zone, with the next downside target at $22.65, and $22.05 thereafter.
SILVER PRICES TECHNICAL CHART
- Pipscollector -