EUR/USD Forecast: Encouraging US inflation data hits the US Dollar
 EUR/USD Current Price: 1.1036
- The United States Consumer Price Index printed at 3.2% YoY in July.
- Stock markets eased from their early highs but retain a positive tone.
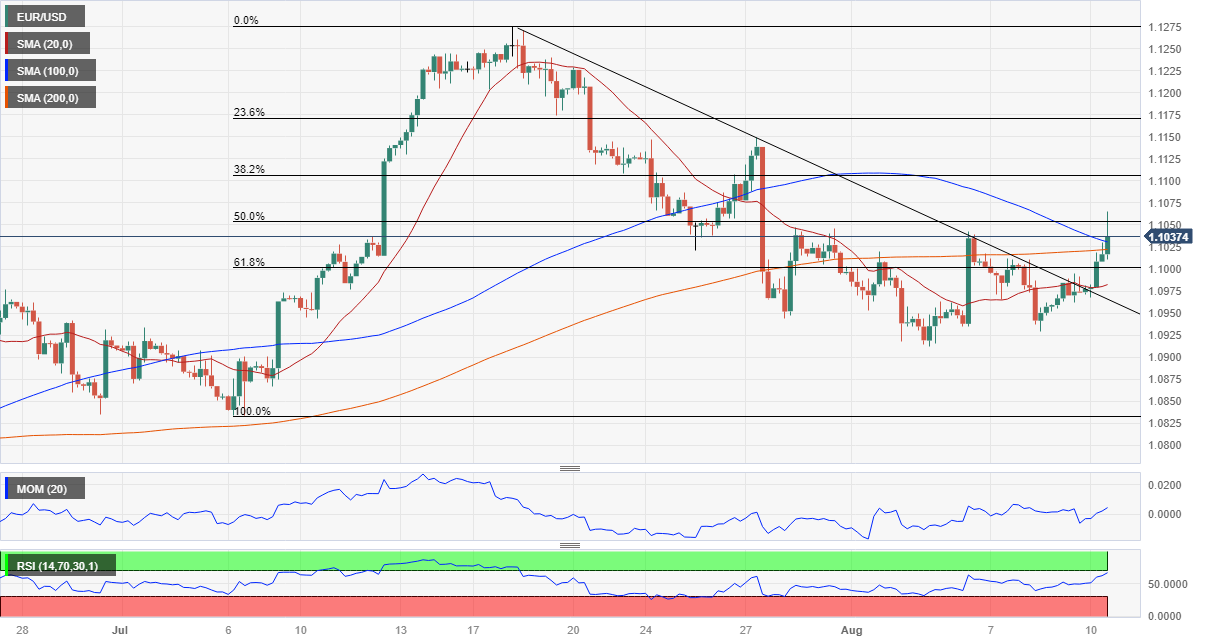
- EUR/USD aiming to turn bullish in the near term, with resistance around 1.1055.
Pipscollector.com - The EUR/USD pair recaptured the 1.1000 level early in the European session, as speculative interest dropped the US Dollar ahead of the release of critical United States (US) data. The pair traded as high as 1.1029 ahead of the release, with the Euro finding support in the better performance of Asian and European indexes, all trading in the green ahead of US figures.
The macroeconomic calendar remained scarce in the Euro Zone, helping the pair retain gains. Finally, the US published the July Consumer Price Index (CPI), which printed at 0.2% MoM and 3.2% YoY, slightly below anticipated. Finally, the annual core inflation rose by 4.7%, easing from the previous 4.8%. The US Dollar plunged with the news, with EUR/USD hitting 1.1064.
The news should ease concerns about a US economic setback, as the odds for another Federal Reserve (Fed) rate hike this year shrunk. Nevertheless, the US Dollar recovered the ground lost with the data ahead of Wall Street’s opening, as stock markets shed some ground and government bond yields tick north.
EUR/USD short-term technical outlook
From a technical point of view, the daily chart for the EUR/USD pair shows it topped around a mildly bearish 20 Simple Moving Average (SMA), but it also shows technical indicators picked up, still below their midlines. The 100 SMA heads north far below the current level, providing dynamic support at around 1.0025. Furthermore, the pair holds above the 61.8% Fibonacci retracement of the 1.0833/1.1275 rally at 1.1005 while below the 50% retracement at 1.1055. Renewed buying interest beyond the latter should allow a continued advance.
In the near term, and according to the 4-hour chart, the risk skews to the upside, although the positive momentum seems limited. Technical indicators head higher within positive levels but losing their early strength. At the same time, the pair has recovered above directionless 20 and 200 SMAs but is currently battling to overcome a bearish 100 SMA.
- Support levels: 1.1005 1.0960 1.0915
- Resistance levels: 1.1065 1.1100 1.1145
- Pipscollector -