Australian Dollar Outlook: AUD/USD Momentum Fading, AUD/JPY Triangle Breakout Next?
AUSTRALIAN DOLLAR, AUD/USD, AUD/JPY, SYMMETRICAL TRIANGLE – TECHNICAL UPDATE:
- Australian Dollar facing key turning points ahead?
- AUD/USD may rise after positive RSI divergence
- AUD/JPY Symmetrical Triangle breakout imminent?
Pipscollectot.com - The Australian Dollar is hovering just above key support against the US Dollar, which is the 78.6% Fibonacci retracement level at 0.6382. Meanwhile, as prices struggled to break lower, positive RSI divergence emerged, showing that downside momentum was fading. This can at times precede a turn higher.
For now, the 20-day Moving Average (MA) held as resistance, preventing AUD/USD from pushing much higher. Moreover, a bearish Death Cross with the 50-day MA remains in play. The latter could hold as resistance, maintaining the broader downside focus.
If not, a drop through support would expose the November low of 0.6272 on the way toward the 2022 low of 0.617.
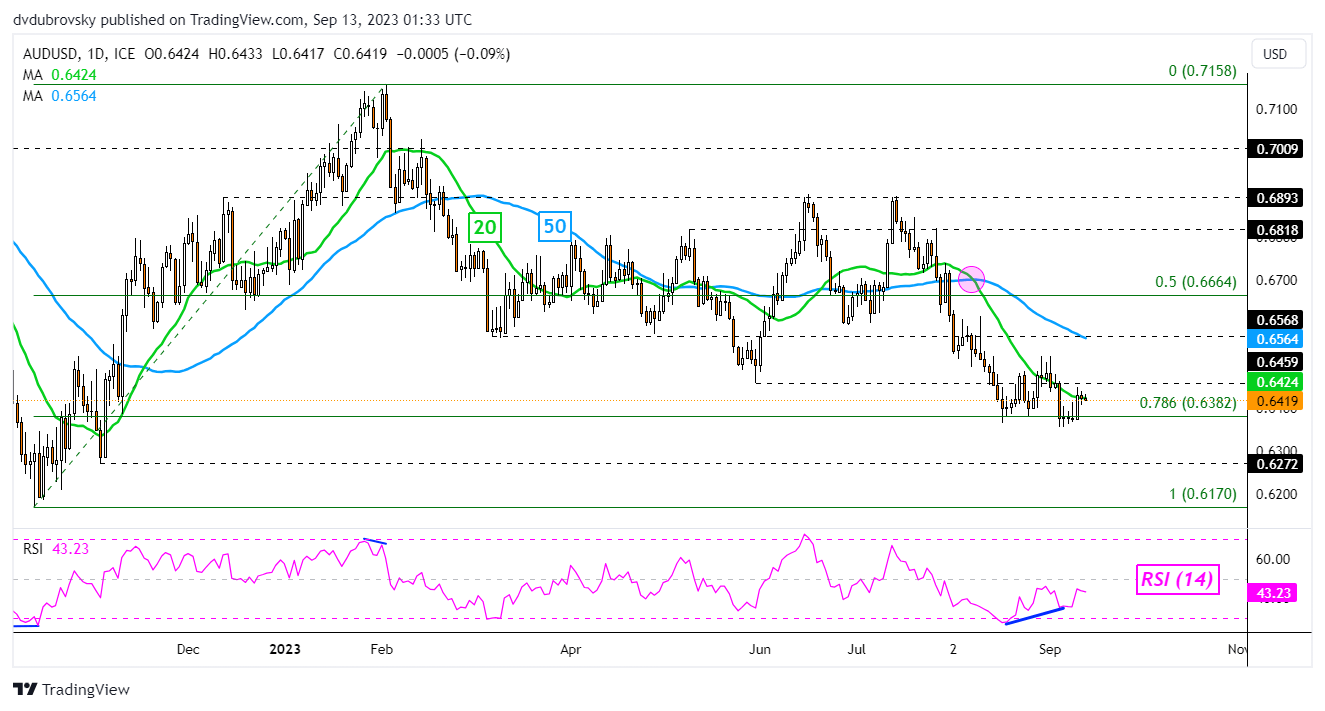
Chart Created in TradingView
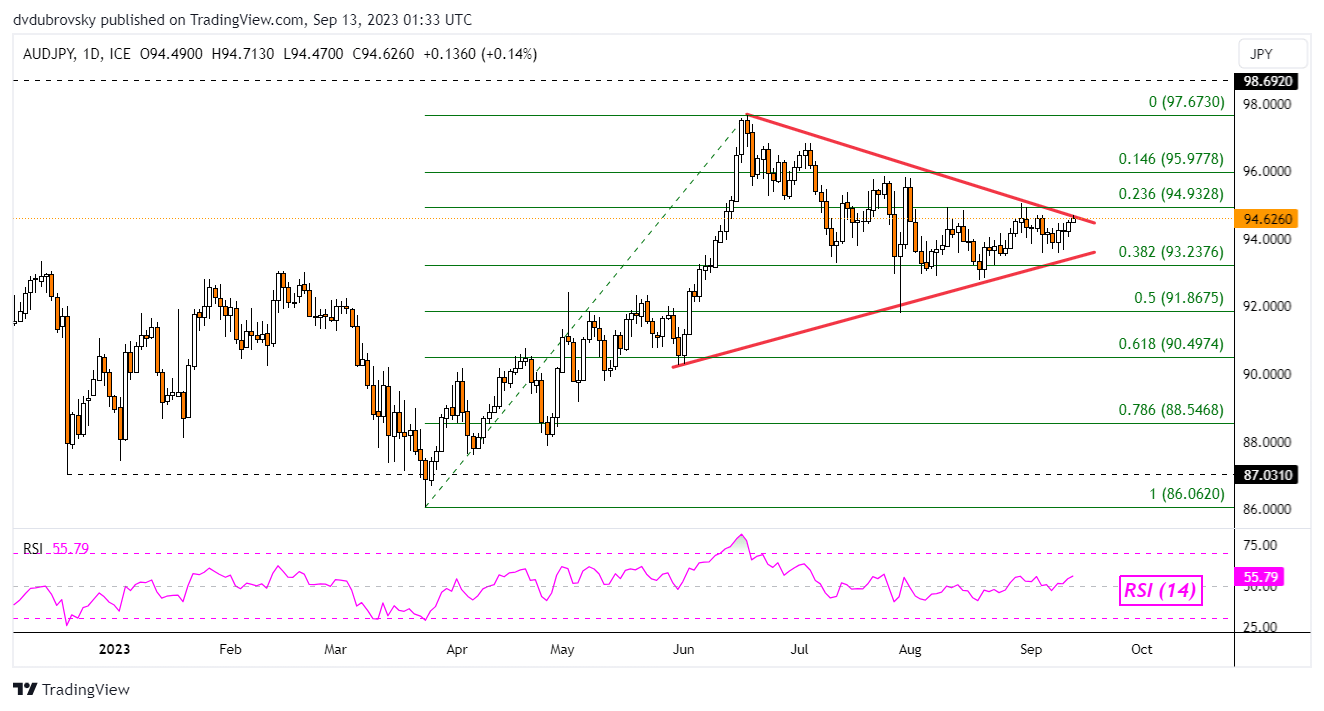
Against the Japanese Yen, the Australian Dollar continues to face a Symmetrical Triangle chart formation. This was created via the falling trendline from June and the rising support line from May. AUD/JPY is quickly running out of room to consolidate within this pattern.
The direction of the breakout could be key for the coming trend. A breach above resistance exposes the 23.6% Fibonacci retracement level of 94.93. Confirming a breakout above this point could open the door to a stronger bullish technical conviction.
That would place the focus on the minor 14.6% level at 95.97 before the current 2023 high of 97.67 kicks in. Otherwise, breaking lower places the focus on the 38.2% point at 93.23. Confirming lower offers a stronger bearish technical conviction towards the midpoint of the retracement at 91.86.
AUD/JPY
| CHANGE IN | LONGS | SHORTS | OI |
| DAILY | -5% | 0% | -3% |
| WEEKLY | 6% | 0% | 3% |
Read more Market Analysis from Pipscollector to update the latest information to help your trading process.
- Pipscollector -